It is very likely that in order to create really powerful models and data analysis using Power Pivot or even for a very simple task performed directly in Excel, you will have to resort to external tables, which are stored in some Web page… if so, I invite you to learn how Power Query can make your life easier in this task.
Example – GDP Analysis
Imagine that we have been asked to analyze the Gross Domestic Product of different countries, and thus understand a little, how their economy has been in recent years, to fulfill our mission, we will use the data we have found on the World Bank website.
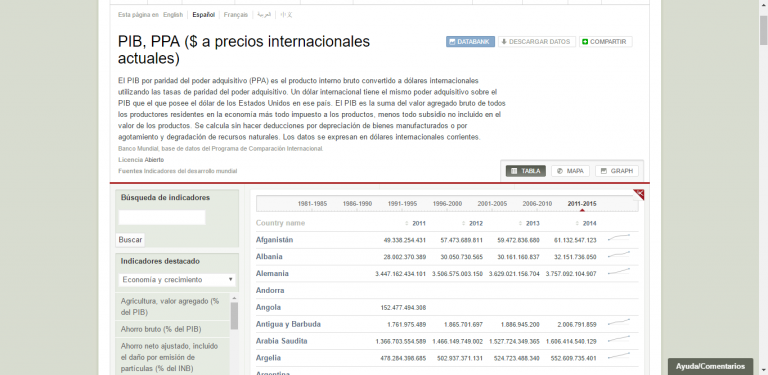
Note: Gross Domestic Product (GDP) is the total amount of goods and services produced by a country over a period of time.
ETL Import – Transform – Load (Extract – Transform – Load) process with Power Query
Import (Extract)
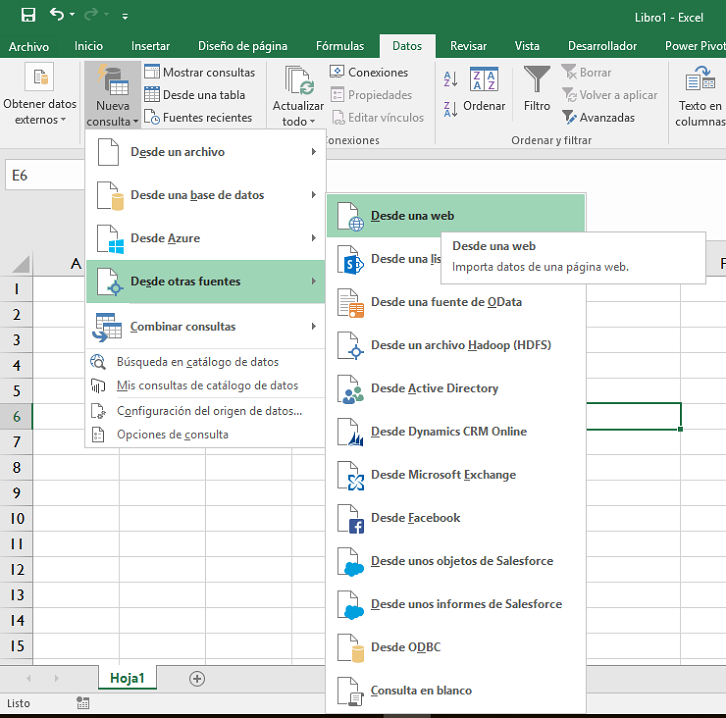
First, we must “load” the data in the Query Editor:
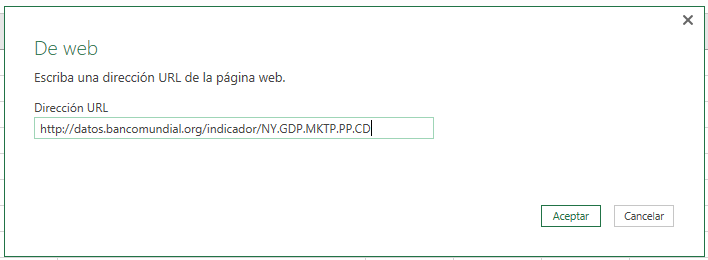
Group Get and Transform -> New Query -> From Other Sources -> From a Web.
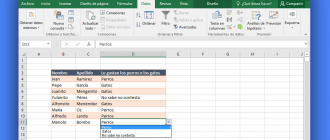
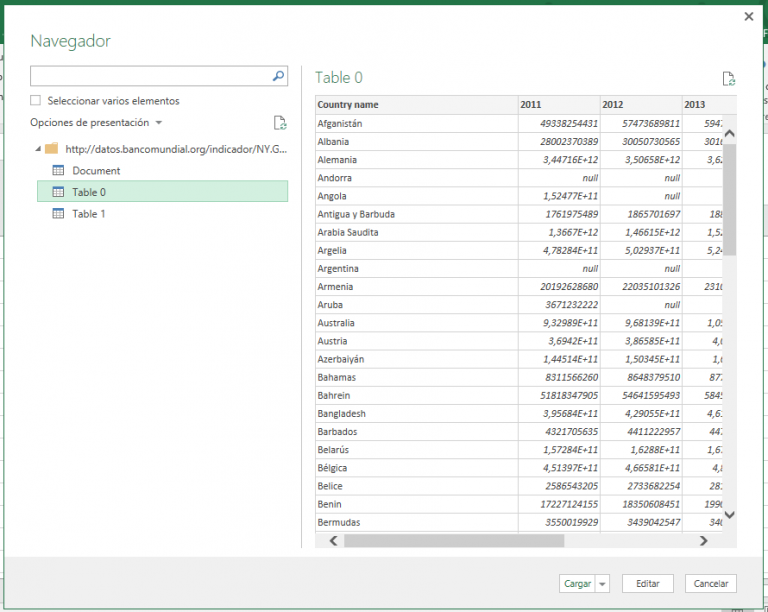
In the Navigator window that immediately appears, the different tables that are in the Web page that we have entered appear, so we must choose the table of our interest, in this case, it is called Table 0, and click on Edit.
In the Navigator window that immediately appears, the different tables that are in the Web page that we have entered appear, so we must choose the table of our interest, in this case, it is called Table 0, and click on Edit.
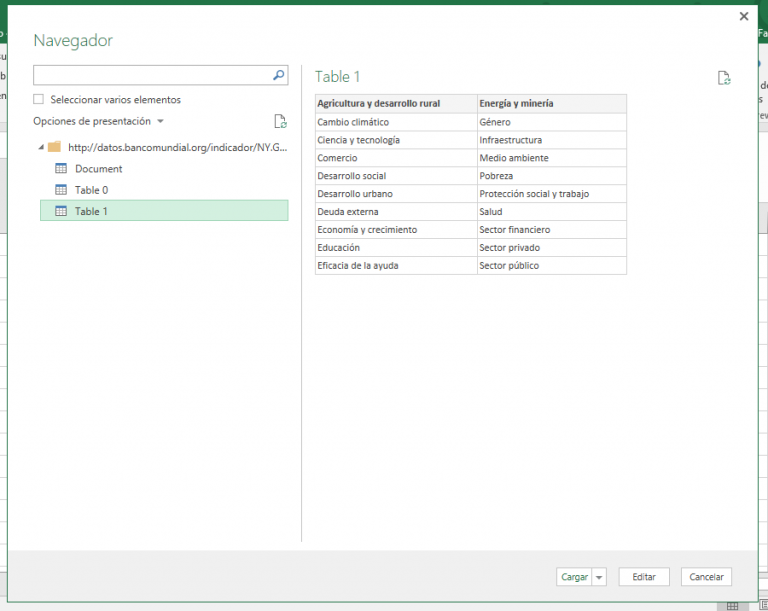
Note: In the following image, you can see the content of another table of the web page named Table 1.
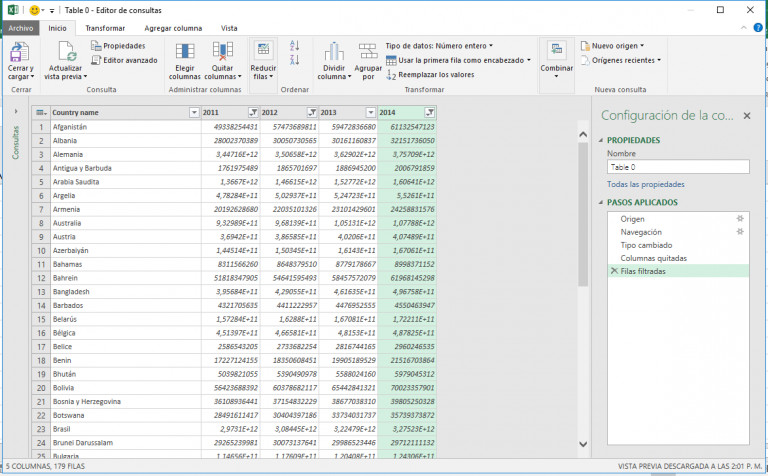
And automatically the Power Query Query Editor appears, the place where the magic happens, with the table of our interest.
Transformation (Transform)
In Power Query’s Query Editor, we are going to perform ALL the necessary transformations, so that the table has a tabular format.
Delete Columns
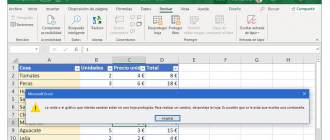
First, we delete the last columns of the table because they do not contain data and are unnecessary.
Keeping CTRL pressed, left click on the columns to be removed to select them -> Right click on any of their labels -> Remove Columns.
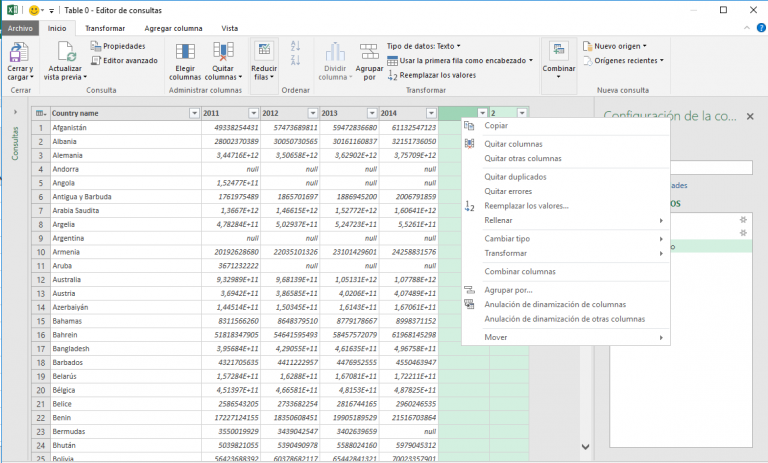
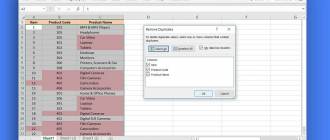
In the previous image, we can clearly see that the table contains rows with some Null values, so they are not useful and consequently we must remove the entire row:
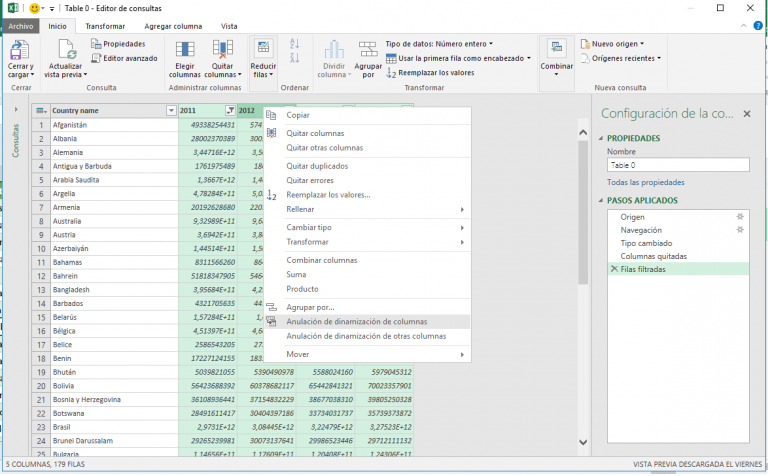
First, we go to the 2011 column and click on the filter button (it appears on the label of each column).
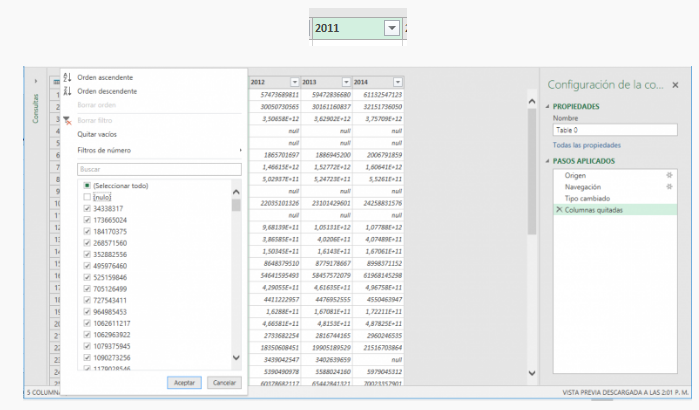
When clicking on the button, different options are displayed to filter the table, (very similar to Excel filters), here we are going to remove the selection of Null values:
In the Filter options we unselect the null values
Note: If we look at the bottom left of the query editor, we can see how the rows containing this item have been removed from the query.
Before:
![]()
Afterwards:
![]()
Remove Rows by applying the Filter on the remaining Columns
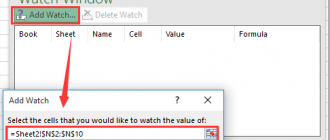
In order to be able to analyze GDP over time, we must have continuous series and no missing values, so if GDP for a country is missing in a single year, it must be removed from the query; consequently, we must remove the null values in the other columns by repeating the filtering process in the remaining columns, thus ensuring that the table is consistent and has no blank fields.
Column Dynamization Override
To facilitate further analysis, we will group the years together in a single column:
Keeping Shift pressed, left click on the 2011 column and then on the 2014 column and thus select all the columns in the middle, including them -> choose the option Override column dynamization.
And Bang!!!!, finally our table gets the appropriate tabular format.

Finally, we change the labels of each column as well as the data type of the column.
To rename a column: Double click on the label -> rewrite the column name.
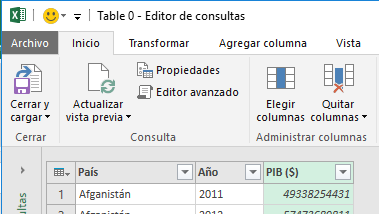
Note: Remember to assign the appropriate data type to each column.
Load (Load)
Now, it only remains to load our table in a sheet of the workbook.
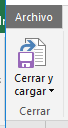
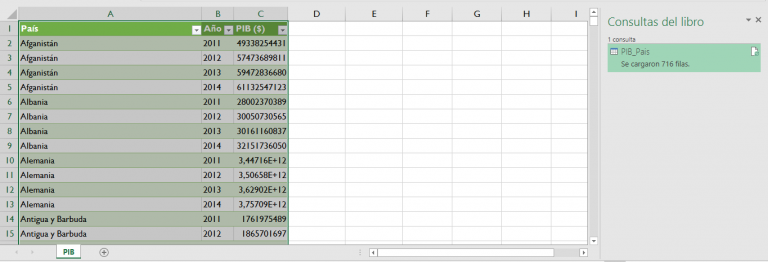
Change the name of the query to GDP_Country -> click on the Close and Load button
And automatically a Structured Table is loaded, from the query we have modified and created.
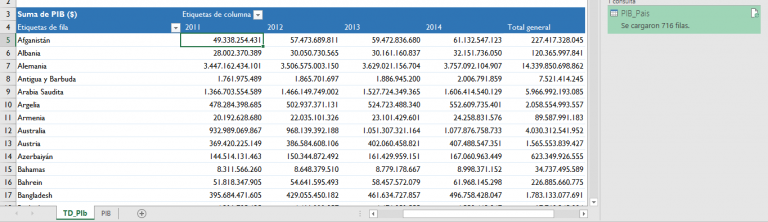
Finally, we are going to create a Dynamics table report with the data from the Web page, in our workbook.
Note: We must have confidence in the Web page from which we are going to take the data, since as they do not depend on us, any modification made may alter the integrity of the report.
Well that’s all for today, next week we will continue to discover more possibilities that provide us with all the Microsoft BI tools, stay connected to all the resources of Excel Free Blog.